EDUC 750 Quiz Quantitative
EDUC 750 Quiz Quantitative Research
Covers the Learn material from Module 4: Week 4.
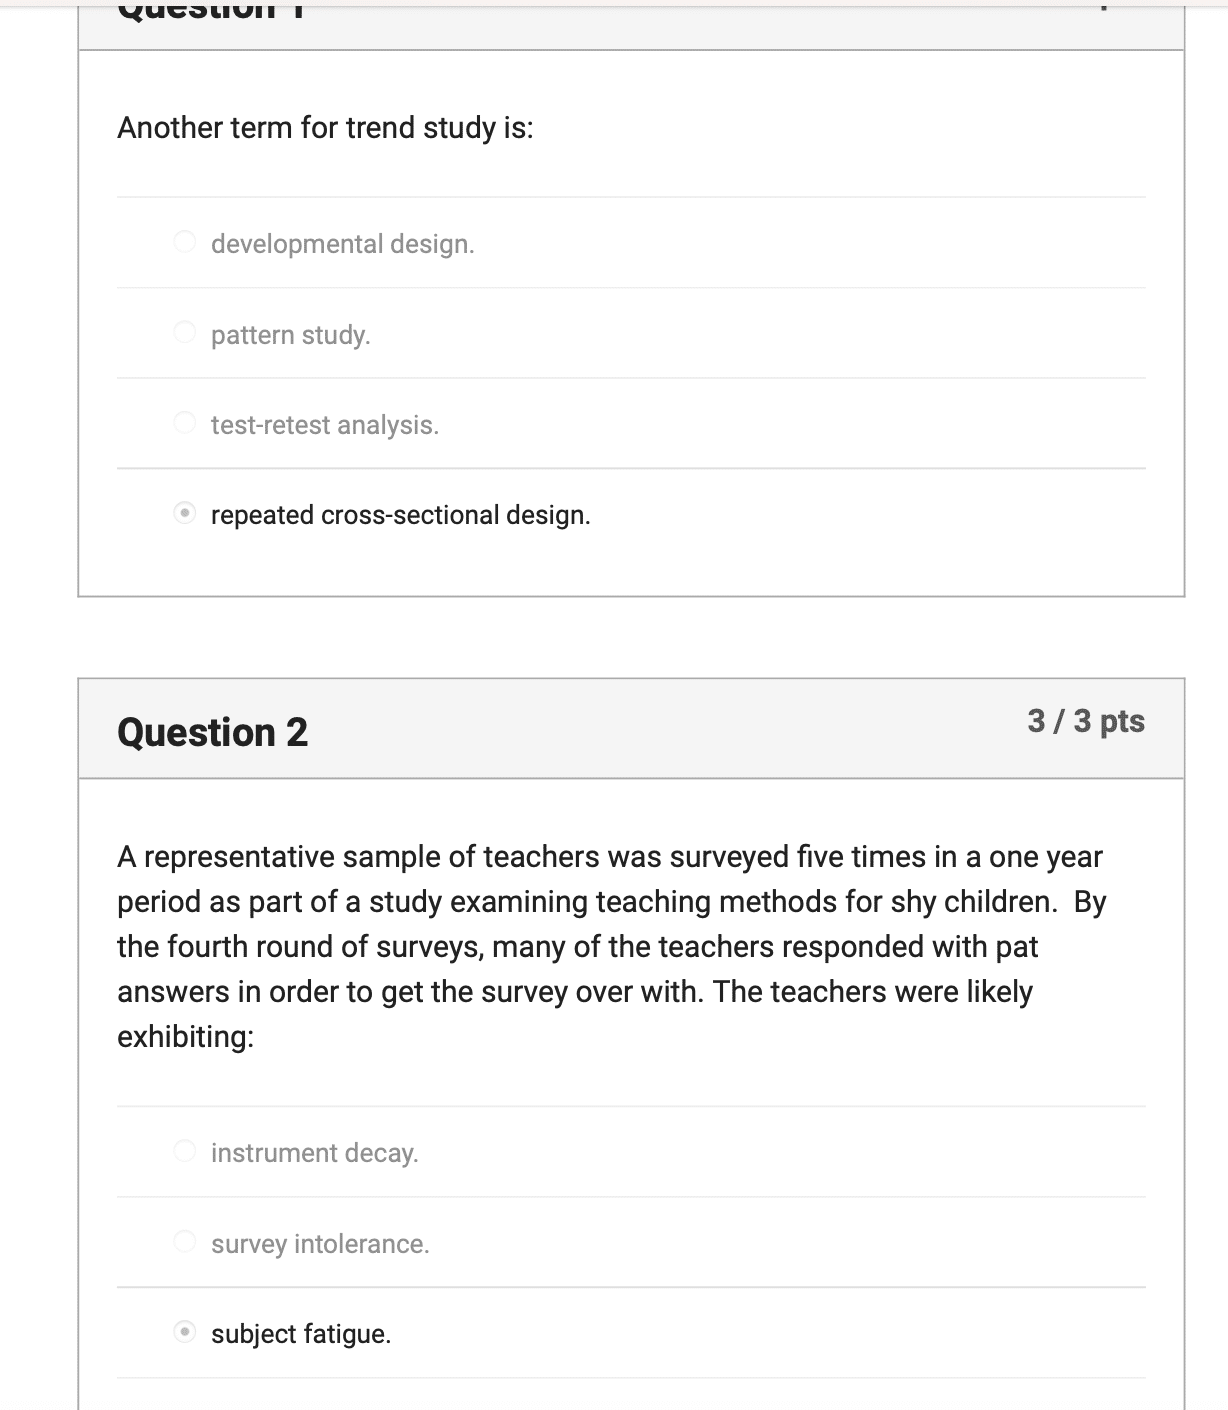
- Another term for trend study is:
- A representative sample of teachers was surveyed five times in a one year period as part of a study examining teaching methods for shy children. By the fourth round of surveys, many of the teachers responded with pat answers in order to get the survey over with. The teachers were likely exhibiting:
- Which of the following is NOT a characteristic of a true experiment?
- Christopher Brown’s (2009) study examining the disconnect between prekindergarten and elementary school teaching approaches was an example of a (n):
- The authors define ceteris paribus as:
- What makes a research design quasi-experimental?
- According to the authors, which type of research design is always preferable?
- Project STAR was the only large-scale, randomized trial study that examined:
- Mortality occurs when natural developments in the subject account for at least some of the observed changes between pretest and posttest.
- Spurious means true or genuine.
- Process analysis is a technique for avoiding treatment misidentification.
- Subjects are not randomly assigned to the comparison and experimental groups in quasi-experimental design.
- According to the _____ hypothesis, there is no relationship in the population; whereas the _____ hypothesis suggests that there is a relationship.
- Which action is NOT included in the preparation for data analysis?
- The _____ indicates how sure we can be, given our particular random sample, that the value of some statistic in the population falls within a particular range.
- The criterion for statistical significance is the probability of _____ that an association is due to chance.
- How may the problem of outliers be addressed in a distribution?
- A bar chart would be the best method of describing which variable?
- An exceptionally high or low value in a distribution is referred to as a(n):
- The concept of _____ is central to the ethical use of statistics.
- Central tendency and variability of distributions are described through:
- The first step in data analysis involves describing the distribution of each variable.
- How we interpret and report statistics determines their usefulness.
- Level of measurement determines the appropriateness of a particular statistic.
- Although data analysis is important, the plan for data analysis does not need to be included in a research proposal.
Other sets
- Nonequivalent control group design is a type of _____ design.
- When members of a treatment group change simply as a result of being part of an experiment this is called:
- Which factor is NOT involved in context?
- True experiments are good at producing _____, but not _____.
- Which of the following is NOT a characteristic of a true experiment?
- An explanation of some characteristic, attitude, or behavior of groups, individuals, or other entities, or of events is called a(n):
- In order to establish a causal relationship, there must be a (n) _____ between variables.
- Project STAR was the only large-scale, randomized trial study that examined:
- Matching is an effective substitute for randomization.
- All true experiments have a posttest.
- A repeated cross-sectional design is better than a panel design for testing causal hypothesis.
- Identification of the context in which a causal relationship occurs is a required criterion for a valid causal relationship
- The mode and median are measures of :
- Which measure of central tendency would be most affected by a small number of extreme cases?
- Which measure of central tendency can summarize variables at the nominal level?
- According to the _____ hypothesis, there is no relationship in the population; whereas the _____ hypothesis suggests that there is a relationship.
- The criterion for statistical significance is the probability of _____ that an association is due to chance.
- The most frequent value in a distribution is the:
- occurs when a researcher concludes there is a relationship between variables in a population when in fact there is none.
- The _____ is computed by taking each score and subtracting the mean; then squaring the difference; then summing all these differences; then dividing this sum by the total number of scores.
- Lack of symmetry is also called:
- Although data analysis is important, the plan for data analysis does not need to be included in a research proposal.
- How we interpret and report statistics determines their usefulness.
- The correlation coefficient is called Pearson’s r.
- Level of measurement determines the appropriateness of a particular statistic.
Set 2
- What makes a research design quasi-experimental?
- True experiments are good at producing _____, but not _____.
- Nonequivalent control group design is a type of _____ design.
- A representative sample of teachers was surveyed ve times in a one year period as part of a study examining teaching methods for shy children. By the fourth round of surveys, many of the teachers responded with pat answers in order to get the survey over with. The teachers were likely exhibiting:
- When members of a treatment group change simply as a result of being part of an experiment this is called:
- In the 1994 book Reviving Ophelia, Mary Pipher uses her psychotherapy cases to illustrate the dicult lives of adolescent girls. The authors of your textbook assert that this is an example of:
- Project STAR was the only large-scale, randomized trial study that examined:
- In a study examining the effects of ADHD medication on school children, the children who don’t receive the medication would be the _____ group.
- Identification of the context in which a causal relationship occurs is a required criterion for a valid causal relationship.
- Mortality occurs when natural developments in the subject account for at least some of the observed changes between pretest and posttest.
- Subjects are not randomly assigned to the comparison and experimental groups in quasi-experimental design.
- All true experiments have a posttest.
- Central tendency and variability of distributions are described through:
- Lack of symmetry is also called:
- Which measure of central tendency would be most affected by a small number of extreme cases?
- Frequency distributions that display percentages must also include:
- According to the _____ hypothesis, there is no relationship in the population; whereas the _____ hypothesis suggests that there is a relationship.
- The most frequent value in distribution is the:
- Statistics used to describe the association among variables and to control for other variables are called:
- The criterion for statistical significance is the probability of _____ that an association is due to chance.
- The correlation coefficient is a measure of: Although data analysis is important, the plan for data analysis does not need to be included in a research proposal.
- The first step in data analysis involves describing the distribution of each variable.
- Secondary analysis involves a substandard data set.
- Level of measurement determines the appropriateness of a particular statistic.
- Although data analysis is important, the plan for data analysis does not need to be included in a research proposal.